Breakfast Cereals Compared: What the Numbers Actually Say
A side-by-side look at 35 cereals available at an Australian supermarket — so you can pick the one that works best for your family.
🕒 Estimated reading time: 10–12 minutes | Data sourced from an Australian supermarket website
Breakfast is one of those meals that can feel deceptively simple — pour, add milk, done. But spend five minutes flipping over cereal boxes and comparing the nutrition panels, and you quickly realise just how different these products are from one another. Fibre content, sugar levels, protein, sodium — the numbers vary far more than the cheerful packaging might suggest.
As a parent, I wanted a clear, honest picture of what is actually in the cereals sitting on supermarket shelves. So I pulled the nutritional data for 35 breakfast cereals available at an Australian supermarket and put them all in one place. No brand favouritism, no agenda — just the numbers, side by side, so you can make the choice that suits your family’s needs.
All values below are per 100g as listed on the supermarket’s website. Keep in mind that serving sizes differ between products, so the per-100g figure is the fairest way to compare like for like.
What to Look for on a Cereal Nutrition Panel
Before diving into the data, here is a quick primer on the key nutrients and what they mean for your family’s breakfast bowl:
Dietary Fibre — Supports digestive health and helps keep kids (and adults) feeling fuller for longer. The Australian Dietary Guidelines recommend children aged 4–8 aim for around 18g of fibre per day from all food sources.
Sugars — This figure includes both naturally occurring sugars (e.g., from dried fruit) and added sugars. A lower number is generally preferable, though context matters — sultanas in a bran cereal contribute natural sugars alongside fibre.
Protein — Supports muscle development and satiety. Cereals with higher protein can be a useful contribution to a child’s daily intake, particularly for active kids.
Sodium — Many processed cereals contain more sodium than you might expect. For children under 8, the recommended daily intake is around 400–600mg, so a high-sodium cereal can use up a meaningful portion of that allowance at breakfast alone.
Calcium & Iron — Many cereals are fortified with these minerals, which are especially important for growing children. Look for products that list these on the panel.
Standout Performers Across the 35 Cereals
Rather than ranking cereals against each other, the insight cards below highlight which products lead in specific nutritional categories. Every family’s needs are different — a cereal that is perfect for one household may not suit another.
High-Fibre Options Worth Knowing About
Fibre is one of the most underrated nutrients in a child’s diet. It supports gut health, helps regulate digestion, and contributes to a feeling of fullness that can reduce mid-morning snack cravings. The following cereals stand out for their fibre content:
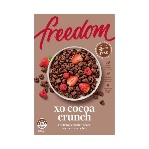
It is worth noting that the bran-based cereals (All-Bran, Sultana Bran, Bran Flakes) achieve their high fibre counts through wheat bran, which is one of the most concentrated dietary fibre sources available. The Freedom Cocoa Crunch is a notable inclusion here — it is a gluten-free option that still delivers a solid fibre count.
Lower-Sugar Options for Everyday Breakfasts
Sugar content in cereals is a topic many parents think about, particularly for school-day breakfasts. The cereals below have the lowest sugar content per 100g in this comparison. Several of them are whole grain biscuit-style cereals, which tend to have minimal added sugar by design.
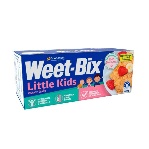
The Weet-Bix family — including the Little Kids Essentials variant — consistently delivers low sugar alongside respectable fibre and protein. The Little Kids Essentials version is also notable for its very low sodium (9mg per 100g), making it one of the most parent-friendly options for young children in this entire comparison.
Higher-Protein Options for Active Families
Protein at breakfast supports sustained energy and muscle function — particularly relevant for kids in sport or active adults. These cereals lead the group on protein content:
Cereals Fortified with Calcium and Iron
Many breakfast cereals are fortified with vitamins and minerals — a useful nutritional boost, particularly for children who may not always meet their daily requirements through other foods alone. The table below shows which cereals in this comparison report calcium and iron values on their nutrition panels.
Not all cereals list calcium and potassium on their panels — a dash (—) in the table below simply means the value was not reported on the Coles product listing, not necessarily that the mineral is absent. Always check the product’s own packaging for the most complete information.
Our Pick: The 3 Most Nutritionally Balanced Cereals
If you are looking for a cereal that performs consistently well across fibre, protein, sugar, and sodium — rather than excelling in just one category — these three stand out from the full list of 35. No single metric is exceptional, but no single metric is a concern either. They are the cereals that work well as an everyday breakfast for most families.
A balanced cereal, for the purposes of this comparison, is one that scores reasonably well across multiple key nutrients simultaneously — decent fibre, moderate-to-good protein, lower sugar, and sodium that is not excessive. It does not need to top any single category; it just needs to avoid red flags across the board.
| Fibre | 9.2g |
| Protein | 11.3g |
| Sugar | 9.0g |
| Sodium | 264mg |
| Iron | 6.3mg |
The most well-rounded profile across all metrics. No single number stands out as a concern. A reliable everyday choice for the whole family.
| Fibre | 12.9g |
| Protein | 12.4g |
| Sugar | 3.0g |
| Sodium | 270mg |
| Iron | 9.1–9.7mg |
Strong fibre and protein with very low sugar — a combination that is hard to find in one cereal. A consistent performer that suits both kids and adults.
| Fibre | 10.2g |
| Protein | 8.1g |
| Sugar | 22.3g* |
| Sodium | 30mg |
| Iron | 7.5mg |
The sugar figure looks high, but this cereal contains apricot pieces and sultanas — the sugars are largely natural fruit sugars, paired with solid fibre and the second-lowest sodium in the entire comparison (30mg).
* Sugar from dried fruit (natural sources)
Sanitarium Weet-Bix Little Kids Essentials (400g) — purpose-built for toddlers and young children, this variant delivers the lowest sodium of all 35 cereals (just 9mg per 100g), strong calcium (383mg), very low sugar (2.7g), and solid fibre (13g). If you have children under 5, this one deserves a place in the pantry.
Full Nutritional Comparison Table — All 35 Cereals
The table below contains the complete nutritional data for all 35 cereals, per 100g, as sourced from an Australian supermarket website. Use this as your reference when comparing products at a glance. A dash (—) indicates the value was not listed on the product’s supermarket listing.
| Image | Product | Energy (kJ) |
Protein (g) |
Fat (g) |
Carbs (g) |
Sugars (g) |
Fibre (g) |
Sodium (mg) |
Calcium (mg) |
Potassium (mg) |
Iron (mg) |
Vit C (mg) |
|---|---|---|---|---|---|---|---|---|---|---|---|---|
| Coles | ||||||||||||
|
Coles Bran Flakes With Sultanas580g | 1430 | 8.4 | 2.0 | 63.5 | 27.7 | 16.4 | 179 | — | — | 6.7 | — |
 |
Coles Corn Flakes440g | 1610 | 7.0 | 1.0 | 84.3 | 6.8 | 2.0 | 350 | — | — | 6.0 | — |
|
Coles High Protein Cereal Puffs Cocoa300g | 1640 | 32.1 | 2.8 | 55.5 | 17.5 | 5.3 | 165 | — | — | — | — |
|
Coles Mighty Grain Cereal495g | 1600 | 17.7 | 3.0 | 66.5 | 21.2 | 7.2 | 350 | 267 | — | 10.0 | 33 |
 |
Coles Rice Puffs475g | 1630 | 7.2 | 1.4 | 85.0 | 8.4 | 1.4 | 390 | — | — | — | — |
|
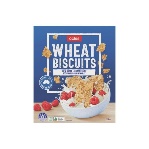
Coles Wheat Biscuits1.12kg | 1460 | 12.5 | 1.3 | 65.6 | 2.7 | 10.9 | 256 | — | — | — | — |
| Freedom | ||||||||||||
|
Freedom Classic Xo Cocoa Crunch360g | 1550 | 7.7 | 3.6 | 69.2 | 21.3 | 13.5 | 64 | — | — | — | — |
| Kellogg’s | ||||||||||||
|
Kellogg’s All-Bran Original High Fibre530g | 1420 | 14.1 | 4.6 | 46.0 | 15.7 | 28.0 | 330 | — | — | 6.7 | — |
|
Kellogg’s All-Bran Wheat Flakes330g | 1490 | 12.2 | 3.6 | 58.9 | 10.8 | 18.8 | 360 | — | — | 7.5 | — |
 |
Kellogg’s Coco Pops Chex Chocolatey500g | 1600 | 6.3 | 1.5 | 83.0 | 29.5 | 3.6 | 495 | — | — | — | — |
 |
Kellogg’s Coco Pops Chocolatey535g | 1640 | 5.6 | 1.3 | 87.2 | 29.7 | 1.9 | 340 | 266 | — | 10.0 | — |
 |
Kellogg’s Corn Flakes725g | 1620 | 7.9 | 1.8 | 81.4 | 8.9 | 4.2 | 535 | — | — | 8.6 | — |
 |
Kellogg’s Crunchy Nut Corn Flakes380g | 1680 | 6.9 | 4.4 | 80.7 | 28.5 | 3.7 | 380 | — | — | 5.1 | — |
 |
Kellogg’s Froot Loops460g | 1680 | 5.6 | 3.6 | 84.1 | 37.7 | 2.4 | 360 | — | — | 10.0 | — |
|
Kellogg’s Just Right (Apricot & Sultanas)460g | 1520 | 8.1 | 2.6 | 70.9 | 22.3 | 10.2 | 30 | — | — | 7.5 | — |
|
Kellogg’s Nutri-Grain Protein1kg | 1630 | 21.8 | 3.0 | 65.2 | 24.0 | 5.3 | 350 | 200 | — | 7.5 | — |
 |
Kellogg’s Rice Bubbles Puffed Rice725g | 1640 | 7.4 | 1.3 | 85.0 | 8.4 | 2.3 | 420 | — | — | 8.6 | — |
|
Kellogg’s Special K Original920g | 1620 | 19.3 | 2.4 | 67.9 | 13.9 | 5.9 | 330 | 500 | — | 7.5 | — |
|
Kellogg’s Sultana Bran High Fibre420g | 1440 | 9.5 | 2.8 | 61.4 | 26.9 | 16.3 | 265 | — | — | 6.7 | — |
| Nestlé | ||||||||||||
|
Nestlé Milo Breakfast Cereal620g | 1590 | 8.7 | 3.8 | 72.2 | 23.9 | 8.9 | 115 | 400 | — | 10.0 | — |
 |
Nestlé Milo Whole Grain Energy & Fibre350g | 1590 | 8.7 | 3.8 | 72.2 | 23.9 | 8.9 | 115 | 400 | — | 10.0 | — |
| Sanitarium | ||||||||||||
 |
Sanitarium Weet-Bix Bites Apricot500g | 1460 | 9.5 | 1.6 | 68.4 | 21.2 | 10.0 | 260 | — | 336 | 6.0 | — |
 |
Sanitarium Weet-Bix Bites Coco Crunch500g | 1630 | 10.0 | 4.9 | 71.0 | 19.9 | 9.2 | 83 | — | 257 | 6.0 | — |
 |
Sanitarium Weet-Bix Bites Honey Crunch510g | 1540 | 11.4 | 1.4 | 72.6 | 18.8 | 8.0 | 323 | — | — | 6.0 | — |
 |
Sanitarium Weet-Bix Bites Wild Berry500g | 1470 | 9.7 | 0.8 | 71.7 | 21.8 | 8.4 | 290 | — | 259 | 6.0 | — |
|
Sanitarium Weet-Bix575g | 1480 | 12.4 | 1.3 | 65.9 | 3.0 | 12.9 | 270 | — | 365 | 9.7 | — |
|
Sanitarium Weet-Bix1.2kg | 1480 | 12.4 | 1.3 | 65.9 | 3.0 | 12.9 | 270 | — | 365 | 9.1 | — |
|
Sanitarium Weet-Bix Little Kids Essentials400g | 1470 | 13.8 | 1.6 | 62.8 | 2.7 | 13.0 | 9 | 383 | 344 | 9.1 | — |
|
Sanitarium Weet-Bix Multi-Grain575g | 1540 | 11.3 | 3.2 | 67.9 | 9.0 | 9.2 | 264 | — | 310 | 6.3 | — |
| Uncle Tobys | ||||||||||||
|
Uncle Tobys Cheerios Honey520g | 1610 | 6.9 | 3.4 | 76.8 | 17.8 | 7.7 | 260 | 400 | — | 10.0 | 33.3 |
|
Uncle Tobys Cheerios Wholegrain560g | 1600 | 7.2 | 3.1 | 76.2 | 14.4 | 8.1 | 260 | 400 | — | 10.0 | 33.3 |
 |
Uncle Tobys Fruity Bites Wildberry500g | 1500 | 7.6 | 2.1 | 72.1 | 24.4 | 7.2 | 43 | — | — | 10.0 | 20 |
 |
Uncle Tobys Plus Antioxidant435g | 1510 | 7.9 | 1.8 | 70.7 | 17.8 | 11.1 | 200 | — | — | 6.0 | 25 |
 |
Uncle Tobys Plus Iron410g | 1600 | 8.8 | 4.5 | 71.7 | 14.2 | 8.1 | 200 | 300 | — | 7.5 | 25 |
| Vita Brits | ||||||||||||
|
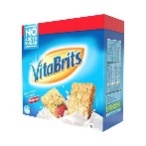
Vita Brits1kg | 1470 | 12.8 | 2.2 | 63.8 | 1.7 | 11.3 | 395 | — | — | — | — |
All values are per 100g. Highlighted cells indicate the leading value in that column across all 35 products. A dash (—) means the value was not listed on the Coles product page.
Final Thoughts
There is no single “best” breakfast cereal — the right choice depends on what your family needs from their morning meal. A child who needs more fibre in their diet will benefit from a different cereal than an active teenager looking for protein, or a toddler who needs low sodium and added calcium. The data in this table is simply a tool to help you make that decision with clear information in front of you.
What I hope this post does is save you time standing in the cereal aisle squinting at the back of boxes. Bookmark this page, use the table as your reference, and feel confident knowing exactly what is in the bowl before the school run.
All figures in this post are per 100g, which is the standard basis for comparison. However, actual serving sizes vary significantly between products — typically between 30g and 45g per serve. A cereal that looks higher in sugar per 100g may actually deliver less sugar per serve if the recommended serving size is smaller. Always check the “per serve” column on the product’s own packaging for the most practical picture.